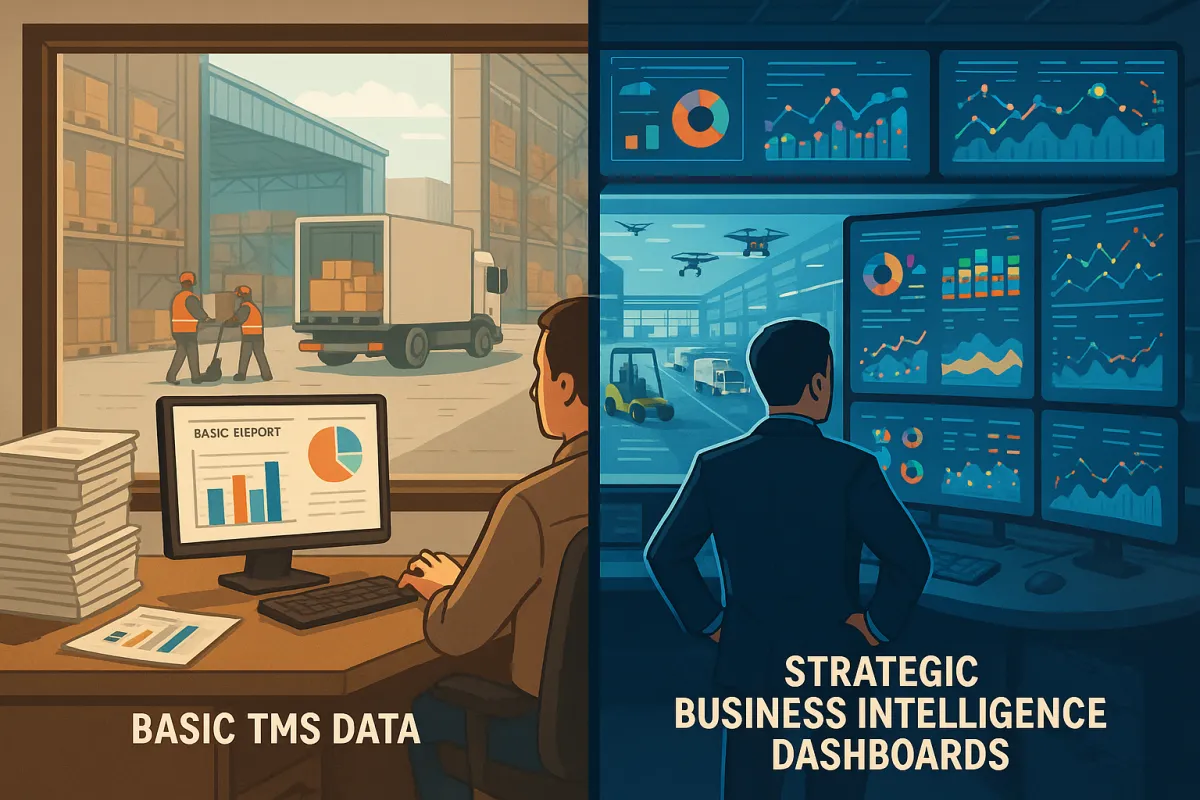
From Basic Reports to Strategic Intelligence: How European Shippers Can Transform TMS Data into Business Intelligence Dashboards That Drive Real ROI

Last quarter's board meeting should have been a wake-up call. Your CFO presented the annual transport spend analysis: €2.4 million flowing through carriers, yet basic reports showed only cost breakdowns and on-time percentages. When pressed for strategic insights about carrier optimization, route efficiency, or cost levers, the conversation stalled. Sound familiar?
76% of logistics transformations fail to achieve their performance objectives. The root cause isn't poor software selection or inadequate carrier relationships. The difference between success and failure? A methodical approach to measuring return on investment, based on concrete and verifiable metrics.
Here's the uncomfortable reality facing European shippers: while TMS platforms generate mountains of data, most organizations extract minimal strategic value from their transport management systems. Transportation management systems are known for offering a strong return on investment (ROI) and rank as one of the most-used supply chain software suites. Yet the majority struggle to demonstrate this value clearly to senior management.
The €280K Analytics Gap: Why 76% of European TMS Implementations Fail to Deliver Strategic Value
A German automotive supplier recently discovered what strategic blindness costs. Despite implementing a €450K TMS three years ago, they couldn't identify which of their six primary carriers offered the best value beyond basic cost per shipment. When a major disruption hit their Frankfurt-Milan corridor in Q2, they lacked the analytical foundation to quickly pivot to alternative routes or carriers.
The missed opportunity? Depending on who you ask, the average new TMS user can shave anywhere from 5% to 15% off its annual freight costs when it starts using the software. For a company spending €2 million annually on transport, that represents €100-300K in potential savings - if you have the analytics to find and capture them.
The Real Cost of Basic TMS Reporting
Basic TMS reporting creates a false sense of visibility. You see shipment status, cost summaries, and carrier scorecards. What you miss are the strategic patterns that drive real optimization:
Lane-specific performance variations that reveal opportunities for carrier consolidation. Seasonal cost patterns that enable proactive contract negotiations. Service level correlations that identify when premium services actually add value. These insights don't emerge from standard reports. They require intentional analytical architecture.
The European manufacturer I mentioned earlier calculated their analytics gap cost €280K annually - money left on the table due to inadequate reporting. They measured basic metrics but couldn't answer strategic questions: Which lanes justify premium carriers? What's the true cost difference between consolidation and speed? Which performance patterns predict future disruptions?
The European Advantage: Regulatory Requirements Driving Advanced Analytics Adoption
According to Renub Research Latest Report Europe Business Intelligence (BI) Software Market is poised for significant growth, expanding from US$ 10.89 Billion in 2024 to US$ 27.23 Billion by 2033, at a Compound Annual Growth Rate (CAGR) of 10.72% between 2025 and 2033. This growth isn't just technology-driven - it's compliance-driven.
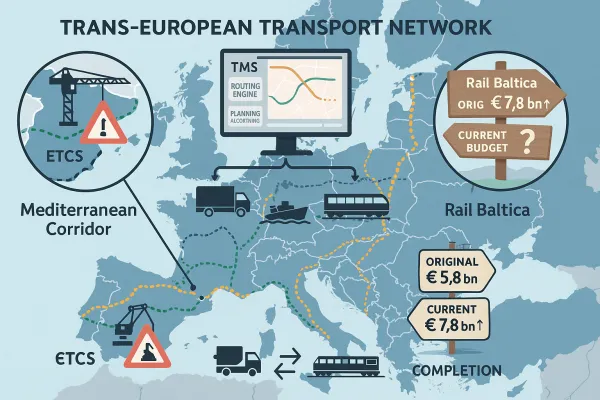
European regulatory requirements create unique advantages for companies that invest in advanced analytics. The Europe Business Intelligence Software Market is on a strong growth trajectory through 2033, fueled by digital transformation, cloud adoption, mobile BI, AI integration, and regulatory compliance. GDPR data governance requirements, eFTI compliance needs, and EU ETS reporting obligations all demand sophisticated analytics capabilities.
The EU ETS shipping costs for 2025 will hit European shippers harder than most expected, with coverage jumping to 70% of emissions from just 40% in 2024. Carriers warn their ETS surcharges could nearly double under the updated regulations - but only companies with advanced analytics can model these impacts and optimize accordingly.
This regulatory pressure creates competitive separation. While North American companies can rely on basic reporting, Retailers use BI for customer analytics and inventory management, while banks leverage it for fraud detection and regulatory compliance. European shippers need analytics that simultaneously optimize costs and ensure compliance. This dual requirement drives more sophisticated implementations.
Building Strategic TMS Dashboards: The 5-Layer Intelligence Framework
Transform your basic TMS reporting into strategic intelligence using a structured approach. This isn't about adding more charts - it's about creating analytical layers that support progressively sophisticated decision-making.
Layer 1: Real-Time Operational Intelligence
Move beyond static reports to live operational dashboards. For example, a transportation KPI dashboard can keep track of the on-time performance by route, carrier, and customer – triggering alerts for delays in real-time. The key difference: your dashboard should anticipate problems, not just report them.
Suppose a team is using Power BI logistics dashboard connected with WMS feeds and real-time TMS. In case of a shipment delay due to port congestion, the system can automatically explore and notify the driver with alternative routes, calculate ETA impact and even include customer support team in the loop – before the delay becomes a customer complaint.
Build dashboards that integrate live data streams: TMS shipment status, carrier APIs for real-time tracking, weather data for route optimization, customs systems for border crossing delays. The goal isn't information overload - it's actionable intelligence that enables proactive responses.
Layer 2: Financial Performance Analytics
Cost analysis goes beyond simple spend summaries. Build analytics that reveal true cost drivers and optimization opportunities. The average new TMS user can shave anywhere from 5% to 15% off its annual freight costs when it starts using the software. But this savings isn't automatic - it requires analytical precision to identify and capture.
Effective financial analytics dashboards should provide lane-by-lane profitability analysis, carrier performance relative to contracted rates, consolidation opportunity identification, and mode selection optimization based on true cost-to-serve calculations. These capabilities transform procurement from reactive cost management to strategic optimization.
The AI-Powered Analytics Revolution: Predictive Intelligence for European Logistics
While basic dashboards report what happened, AI-powered analytics predict what will happen. As AI and ML become embedded in BI platforms, they revolutionize data collection and interpretation. AI-driven analytics tools now provide predictive insights, real-time automated data processing, and sophisticated visualizations. These capabilities allow organizations to make proactive, data-informed decisions.
European logistics companies are leveraging AI for disruption prediction, demand forecasting, and dynamic routing optimization. A French retailer using AI-powered TMS analytics reduced emergency freight costs by 35% by predicting capacity constraints three weeks in advance.
Our TMS helps customers reduce transportation spend by 5%+ through intelligent optimization. But the real value lies in predictive capabilities that prevent problems rather than react to them. Machine learning algorithms analyze historical patterns, external data sources, and real-time conditions to recommend optimal decisions before human analysis would identify the opportunity.
Leading TMS platforms like Cargoson, MercuryGate, and Oracle TM now embed predictive analytics directly into their dashboard interfaces. These systems move beyond historical reporting to forward-looking intelligence that guides strategic decisions.
Integration Architecture: Connecting TMS Intelligence to Enterprise Systems
Strategic intelligence requires data integration beyond your TMS. A supply chain dashboard integrates live data across integral touchpoints i.e. TMS, carrier APIs, WMS, and even IoT sensors – offering logistics teams with an in-depth view of operations.
Build API-first architecture that connects your TMS intelligence to ERP financial data, WMS inventory levels, CRM customer profiles, and external data sources like weather, traffic, and economic indicators. This integration transforms isolated transport data into comprehensive business intelligence.
API-First Analytics Architecture
Modern TMS implementations require seamless data exchange. Yes, our TMS solution is Software-as-a-Service (SaaS)-based and platform-agnostic, enabling seamless integration with all major technologies, including WMS, OMS, ERP, EDI, CRM, accounting software, digital freight providers, shipment tracking platforms and more.
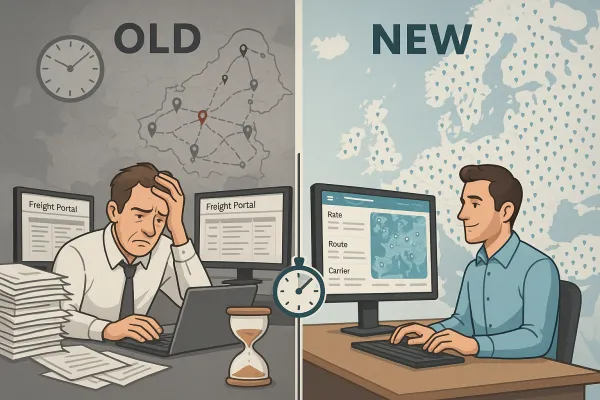
Cloud-native platforms like Cargoson, FreightPOP, and Shippo architect integration-first approaches that enable real-time data sharing across enterprise systems. This connectivity enables analytics that consider transport performance in broader business context - customer satisfaction, inventory optimization, and financial performance.
Measuring Success: KPIs and ROI Metrics for TMS Business Intelligence
Strategic analytics require strategic metrics. Move beyond operational KPIs to business impact measurements that demonstrate clear ROI.
Essential analytics KPIs include: Dashboard adoption rates (target >80% within first year), decision speed improvements (time from problem identification to resolution), cost optimization identification (percentage of transport spend optimized through analytics), and strategic initiative success rates (percentage of improvement projects that achieve targets).
Calculate ROI using measurable benefits: €85K fuel savings through optimized routing, €120K productivity gains from automated reporting, €25K dispute reduction through better visibility, €50K emergency freight avoidance through predictive analytics. Total annual benefit: €280K on a €450K TMS investment delivers 62% first-year ROI.
Success metrics should align with business objectives. This shifts your TMS business case from cost optimization to risk mitigation. Frame your investment around business continuity, not just efficiency. Show how manual processes failed during disruptions while automated systems adapted.
Implementation Roadmap: Your 90-Day TMS Intelligence Transformation
Transform basic reporting into strategic intelligence using a structured 90-day approach:
Days 1-30: Analytics Audit & Architecture
Catalog existing reports and identify intelligence gaps. Map data sources and integration requirements. Define strategic questions your analytics should answer. Design dashboard architecture that supports progressive sophistication.
Days 31-60: Dashboard Development & Integration
Build Layer 1 operational dashboards with real-time data feeds. Implement financial analytics with cost optimization identification. Connect external data sources for comprehensive visibility. Test predictive capabilities with pilot use cases.
Days 61-90: Advanced Analytics & AI Implementation
Deploy predictive algorithms for disruption identification and demand forecasting. Implement automated alert systems for optimization opportunities. Train teams on strategic analysis techniques. Measure initial ROI and refine approaches.
Platform selection influences implementation speed significantly. Cloud-native solutions like Cargoson, FreightPOP, and modern platforms typically deploy analytics capabilities in 6-12 weeks, while legacy enterprise solutions like SAP TM or Oracle TM often require 6-12 months for comparable functionality.
The transformation from basic reporting to strategic intelligence isn't just technological - it's organizational. Companies that successfully implement advanced TMS analytics typically achieve 15-25% reduction in transport costs within the first year, not through revolutionary changes, but through systematic optimization guided by strategic intelligence.
Your next board meeting could tell a different story. Instead of basic cost reports, present strategic insights about optimization opportunities, risk mitigation successes, and competitive advantages gained through intelligent transport management. The analytics capabilities exist - the question is whether you'll implement them before your competitors do.