The 60-Day TMS Performance Measurement Framework: How European Shippers Can Track, Benchmark, and Optimize ROI Using Proven KPIs and Industry Standards

Your TMS investment promises 15% freight cost savings and operational efficiency gains. Six months later, you're still waiting for concrete proof of ROI. 76% of logistics transformations fail to achieve their performance objectives, and most European shippers struggle with the same challenge: measuring TMS performance without clear benchmarks or methodology.
The average new TMS user can shave anywhere from 5% to 15% off its annual freight costs when it starts using the software, yet many companies can't demonstrate these savings to stakeholders. The problem isn't the technology—it's the measurement framework.
This guide provides a practical 60-day TMS performance measurement framework specifically designed for European shippers managing €10M+ transport budgets. You'll get proven KPIs, industry benchmarks, and step-by-step tracking methodologies that deliver measurable ROI before your next quarterly review.
The European TMS Performance Measurement Challenge
European transport costs have exploded, with logistics costs exploding by 5.5% and driver shortage affecting 50,000 positions in France. Yet most shippers can't accurately measure whether their TMS investments are addressing these challenges.
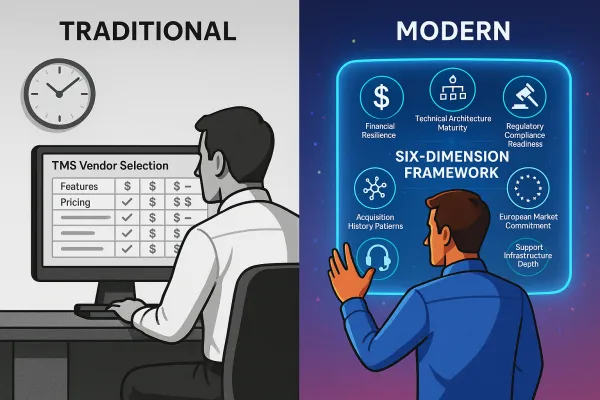
The numbers tell a sobering story. The European TMS market reached €1.4 billion in 2024 and is growing at 12.2% annually, driven by companies seeking operational transformation. But most TMS proposals contain phrases like "improved efficiency," "better visibility," and "enhanced collaboration" without quantifying the financial impact.
Consider this scenario: A German automotive parts supplier invested €800,000 in a TMS implementation, only to discover six months later that their new system couldn't handle their complex carrier network across 12 countries. The lack of upfront performance benchmarks made it impossible to identify integration gaps before they became expensive problems.
Major platforms approach measurement differently. Oracle TM and SAP TM offer comprehensive analytics suites but often require extensive configuration. Blue Yonder provides sophisticated optimization algorithms with built-in KPI tracking. In contrast, cloud-native solutions like Cargoson integrate performance measurement directly into their platform, making baseline establishment faster for European shippers.
The measurement gap costs European companies millions annually through missed optimization opportunities, delayed problem identification, and inability to demonstrate technology ROI to finance teams.
Building Your 60-Day Measurement Framework Foundation
Effective TMS performance measurement starts with the right KPIs. 89% of shippers and 90% of carriers agree KPIs are a crucial part of sound logistics management, but selecting meaningful metrics requires understanding European market standards.
Based on research from 1,000 shippers and carriers, these seven KPIs deliver the highest impact for European transport operations:
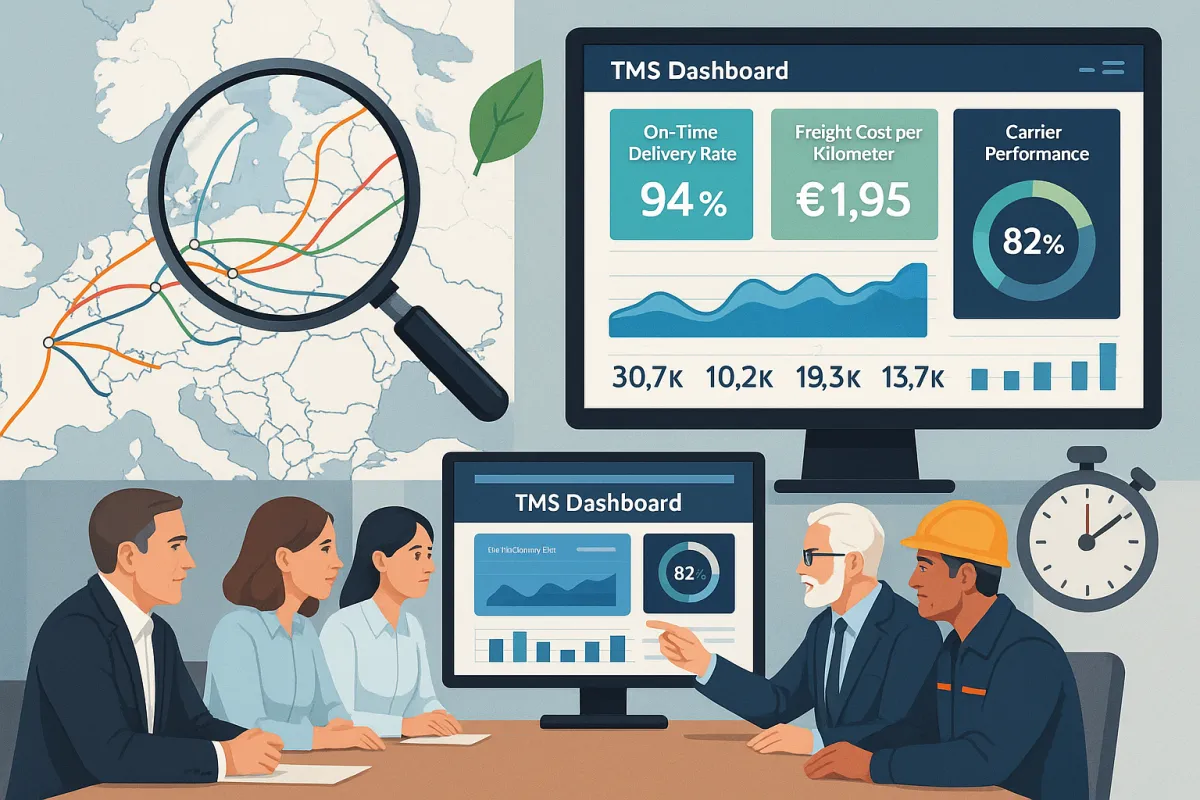
On-Time Delivery Rate (OTD) remains the foundation metric. In the logistics industry, an on-time delivery rate of 95% or higher is a typical benchmark. European retailers like Walmart assess penalties for both early and late deliveries, making precision measurement essential.
Freight Cost per Kilometer provides direct cost visibility. In 2025, with an average cost of €0.45 per kilometer for a utility vehicle, each kilometer saved represents a direct measurable gain. This metric enables immediate ROI calculations.
Route Optimization Efficiency measures actual versus optimal routing. A well-optimized TMS typically generates 15 to 25% kilometer savings, but these gains can vary from 5% on already well-optimized routes to 40% on historically poorly planned routes.
Invoice Accuracy Rate indicates process automation success. If below 95% accuracy for a carrier, it's a red flag requiring immediate attention to billing processes and carrier integration quality.
Carrier Performance Scores track service quality across your network. This includes delivery performance, damage rates, and communication responsiveness—metrics that directly impact customer satisfaction.
Load Planning Efficiency measures capacity utilization and consolidation opportunities. Poor load planning wastes both fuel and carrier capacity, directly impacting transport costs.
Exception Management Response Time tracks how quickly your team identifies and resolves transport disruptions, a capability that becomes increasingly valuable during supply chain volatility.
Platform capabilities vary significantly. MercuryGate and Descartes offer robust KPI configuration tools but require technical setup. Transporeon provides excellent European carrier integration with built-in performance tracking. Solutions like Cargoson simplify KPI setup through automated data collection and pre-configured European logistics benchmarks.
Week 1-2: Rapid Baseline Configuration and Data Collection
Your first two weeks determine framework success. Focus on immediate baseline establishment rather than perfect configuration.
Start with your current transport data. Extract the last three months of shipment records, including origins, destinations, carriers used, actual costs, and delivery performance. Most European shippers underestimate their data quality—expect to find gaps in carrier performance tracking and route efficiency measurement.
GoComet's Transportation Management System can deliver up to 15% cost savings and transform your logistics operations—starting day one. However, capturing these gains requires immediate measurement capability. Your baseline data collection should include current manual process costs.
Suppose your operations staff costs $40/hour. If a TMS eliminates 60 hours of manual work in the first month, that's immediate measurable savings. Document time spent on manual carrier communication, rate shopping, and shipment tracking. These process improvements often deliver the first visible ROI.
Configure your primary KPIs within 48 hours. Alpega and nShift typically require 1-2 weeks for basic KPI setup, while Cargoson's automated configuration can establish baseline tracking within days. The speed advantage matters when you need to demonstrate value quickly to stakeholders.
Focus on three immediate metrics: freight cost per shipment, on-time delivery percentage, and manual process time elimination. These provide concrete baseline measurements for ROI calculations.
Week 3-4: Advanced KPI Implementation and Benchmarking
Week three expands your measurement scope to include operational efficiency and carrier performance benchmarks.
Implement route optimization tracking. A well-optimized TMS typically generates 15 to 25% kilometer savings, but measuring this requires comparing actual routes against system-recommended optimization. Many European routes have complex cross-border requirements that affect optimization potential.
Establish carrier performance benchmarking. Create scorecards tracking delivery performance, damage rates, communication quality, and invoice accuracy for each carrier in your network. Most European shippers work with 20-30 regular carriers but could benefit from access to 200-300 qualified providers.
Configure automated reporting for weekly KPI reviews. Transporeon's analytics dashboard provides excellent European market comparisons, while Blue Yonder offers sophisticated optimization reporting. Cargoson's built-in European compliance tracking simplifies regulatory performance measurement, a capability that becomes increasingly valuable with upcoming eFTI requirements.
This phase often reveals optimization opportunities worth 3-5% additional freight savings. Document these findings as they support your ongoing business case for TMS investment.
Month 2: Performance Analysis and Optimization Cycles
Month two shifts from measurement setup to performance optimization using your established KPI framework.
Implement weekly performance reviews focusing on trend identification rather than single-week variations. The average new TMS user can shave anywhere from 5% to 15% off its annual freight costs when it starts using the software, but realizing these savings requires systematic identification of improvement opportunities.
Your optimization cycles should target specific areas weekly. Week five focuses on route efficiency—identify routes with poor optimization scores and analyze constraints preventing better performance. Week six examines carrier performance variations, identifying which providers consistently outperform benchmarks and which require performance discussions.
Week seven addresses exception management. As you gather data: refine carrier mix by redirecting volume to high-performing carriers, open new lanes using analytics to identify underserved routes ripe for consolidation, and automate more processes expanding automated workflows.
Week eight consolidates findings into ROI documentation. Gartner reports that TMS solutions with optimization features can deliver 2–15% ROI on transportation spend—and often in the first few months of deployment. Your documentation should quantify specific savings achieved and project annualized benefits.
Cloud-based transportation management systems have gained increased popularity in recent years owing to the quick and easy setup, low initial cost, and reduced dependency on hardware requirements. This deployment speed advantage enables faster optimization cycles and quicker ROI realization.
European-Specific Benchmarks and Compliance Integration
European transport operations require region-specific performance standards addressing cross-border complexity and sustainability regulations.
Europe transportation management system industry is expected to register moderate CAGR from 2025 to 2030, fueled by the region's strong focus on sustainability, cross-border trade, and regulatory compliance. Your performance framework must address these regional priorities.
Sustainability metrics become increasingly important. Some TMS vendors—European companies, in particular—are exploring partnerships, adopting frameworks and developing standard methodologies for calculating the environmental impacts of certain transportation options in response to companies' requests for these capabilities. Track carbon emissions per shipment, modal shift opportunities, and consolidation rates.
Cross-border performance requires specific measurement approaches. Monitor customs clearance times, documentation accuracy for international shipments, and carrier performance across different European countries. VAT compliance accuracy and eFTI readiness become competitive advantages.
Regulatory compliance tracking prevents costly violations. Monitor driver hour compliance, vehicle weight regulations, and country-specific transport requirements. Enterprise solutions like Oracle TM and SAP TM offer comprehensive compliance modules, but many require custom configuration for European regulations. Cargoson's built-in European compliance tracking simplifies this requirement with automated monitoring of regional transport rules.
Benchmark against European market standards rather than global averages. European logistics density, cross-border complexity, and driver shortage create unique performance parameters that differ from North American or Asian markets.
Sustaining and Scaling Your Performance Framework
Long-term TMS value requires evolving your measurement framework beyond initial ROI demonstration toward continuous improvement and competitive benchmarking.
External benchmarking allows companies to compare their performance to industry standards, ensuring they remain competitive. Long-term trend analysis empowers business leaders with data that can reveal patterns that can be addressed with targeted improvements. By analyzing the results of these improvements, business leaders can create a virtuous cycle of ongoing improvements.
Establish quarterly benchmark reviews comparing your performance against industry standards and competitor intelligence. It's also recommended to collect external data from industry associations, research reports, or benchmarking databases to establish industry benchmarks and reference points. European logistics associations provide valuable sector-specific performance data.
Scale your framework as transport volumes grow. Smaller shippers rely most heavily on their WMS for logistics KPI management and are least likely to use a transportation management system (TMS). As shippers get larger, reliance on WMS for KPI management declines, while ERP and TMS usage grows. Plan framework expansion to accommodate increased complexity and additional carriers.
Integrate advanced analytics capabilities. Real-time data fuels both predictive analytics, which predict what may happen next in the supply chain, and prescriptive analytics, which provides recommendations for how to respond to supply chain scenarios. This unprecedented level of visibility empowers business leaders to make data-driven decisions, improving KPIs and overall supply chain performance.
Your measurement framework should evolve from reactive reporting to predictive optimization. Major platforms like Blue Yonder and Transporeon offer advanced analytics modules, while newer solutions including Cargoson integrate AI-driven insights for growing European businesses seeking scalable performance optimization.
Remember: benchmarking is not a one-off exercise. To truly improve logistics performance, organisations need to continuously monitor their KPIs and repeat the benchmarking process regularly. This allows businesses to track the impact of changes they implement and make further adjustments as necessary.
Success in TMS performance measurement comes from treating it as an ongoing business capability rather than a quarterly reporting requirement. The companies getting approval in 2025 are those showing CFOs exactly how their TMS investment delivers measurable business value from day one.
Your 60-day framework provides the foundation for long-term transport optimization and competitive advantage in the increasingly complex European logistics market.