The €800,000 Mistake: How to Diagnose and Prevent TMS Implementation Failure Before It Costs Your European Company Millions

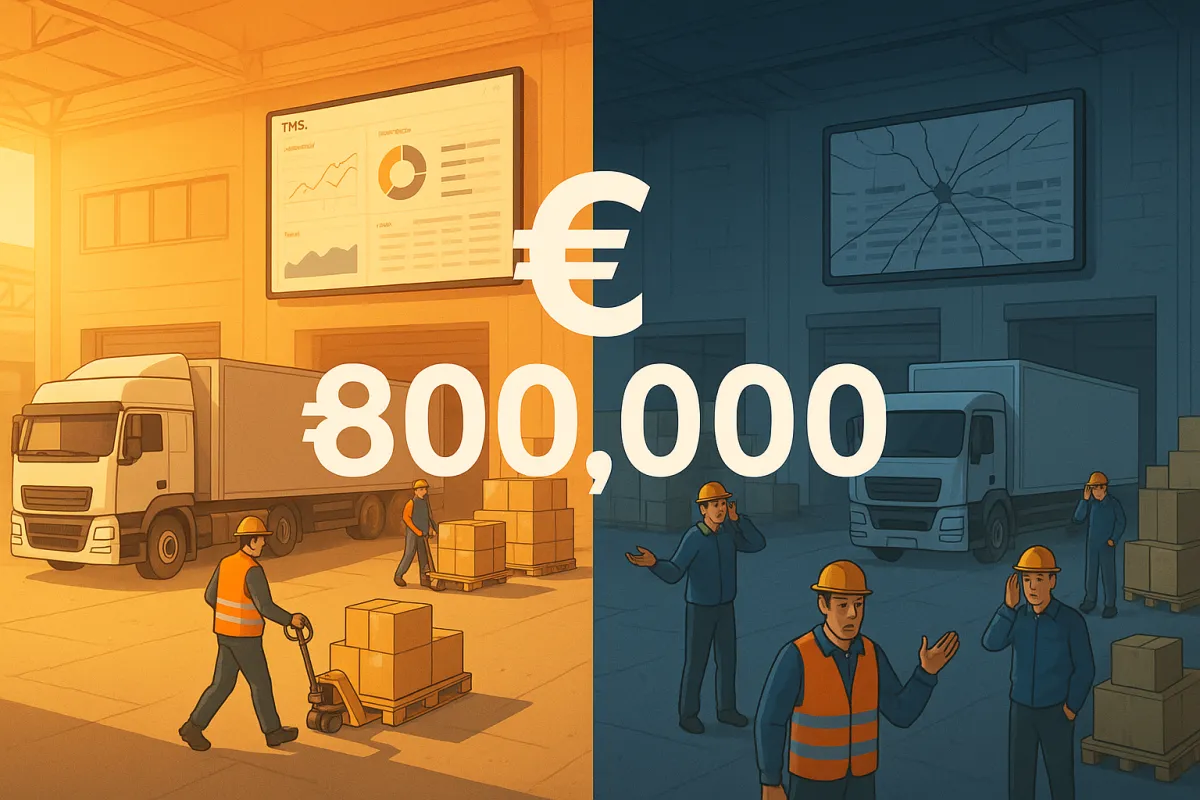
That German automotive parts manufacturer I mentioned in the opening? They discovered six months in, with €800,000 already spent, that their new system couldn't handle their complex carrier network across 12 countries. They chose a North American-focused platform before discovering their primary carriers couldn't integrate without costly custom development. Sound familiar? This isn't an isolated incident.
76% of logistics transformations fail to achieve their performance objectives. Yet the European TMS market reached €1.4 billion in 2024 and is growing at 12.2% CAGR, forecasted to reach €2.5 billion by 2029. Companies are investing heavily in digital transformation while most implementations crash into the same predictable obstacles.
Here's what the successful 24% do differently: they diagnose potential failures before writing checks.
The Financial Reality Check: What Success Actually Costs vs. What Failure Costs
ROI calculations tell the story most clearly. Successful implementations start with specific numbers: "Current freight spend: €2.1M annually. Target reduction: €315K year one through route optimization and carrier selection." Compare this to vague promises of "improved efficiency," "better visibility," and "enhanced collaboration" without quantifying the financial impact.
Most companies see ROI within 6-18 months, depending on the scale of implementation and initial investment. But here's where expectations meet reality: on-premise costs can quickly escalate beyond €200,000 in the first year for smaller and mid-sized carriers, with annual maintenance fees continuing to compound regardless of business performance.
The timing advantage matters enormously. Cloud solutions typically achieve 5-10% freight cost reductions within 3-6 months, while on-premise implementations often require 12-18 months to show meaningful returns. When your CFO is expecting results, six months can feel like six years.
The Learning Curve Nobody Talks About
Even successful implementations follow a predictable learning curve. Year one delivers about 60% of projected savings as teams adapt to new processes. By year three, mature implementations typically deliver 120% of original projections as optimization strategies compound.
Adoption is a leading indicator for ROI. Target >80% adoption within the first year, measured by the percentage of bookings actually made through the TMS versus email and Excel workarounds. When transport planners under pressure revert to familiar tools, ROI calculations become wishful thinking.
The Five Fatal Warning Signs Your TMS Implementation Is Heading for Disaster
Warning Sign #1: Integration Delays That Compound Into Crisis
The most expensive failures start with integration optimism. Enterprises often run heavily customized ERP and WMS platforms that lack modern APIs, pushing TMS integration projects to 6-18 months and budgets from $500,000 to $5 million. Data migration uncovers inconsistent formats and outdated business logic, requiring extensive cleansing. Parallel system runs prolong go-live cycles, and middleware layers add license fees.
European complexity amplifies this challenge. European shippers deal with carrier networks that span everything from large multinational logistics companies to regional specialists who still fax rate sheets. Your TMS needs to handle API integrations with DHL and manual data entry for that crucial last-mile provider in rural Italy.
Warning Sign #2: ROI Calculations Built on Fantasy, Not Reality
Companies failing with their business cases make three recurring mistakes: calculating ROI based on maximum theoretical savings instead of realistic benchmarks, ignoring implementation costs beyond software licensing, and underestimating the time required for user adoption and process changes.
The math looks compelling on paper: a well-optimized TMS typically generates 15-25% kilometer savings, with an average cost of €0.45 per kilometer for a utility vehicle in 2025, meaning each kilometer saved represents a direct measurable gain. But these are best-case scenarios, not guaranteed outcomes.
Warning Sign #3: Legacy System Compatibility Issues
They chose a North American-focused platform six months before discovering their primary carriers couldn't integrate without costly custom development. Geographic focus isn't just a feature preference - it's a fundamental architecture decision that impacts every integration.
A Dutch food distributor selected Oracle Transportation Management based on its North American success stories. They discovered too late that their system couldn't handle the different EDI standards used by German carriers versus French ones.
Warning Sign #4: Change Management Underestimation
Companies often underestimate the cultural change management required for European implementations. When your Polish subsidiary has been managing transportation one way for 15 years, switching to a centralized TMS managed from headquarters in Frankfurt creates resistance that goes beyond typical software adoption challenges.
Experienced freight coordinators who've been managing carriers and routes for years resist abandoning methods that work for them, especially when nobody explains why the new system is actually better.
Warning Sign #5: Extended Implementation Timelines Without Milestone Management
Some TMS implementations took 18 months instead of 6. Others required expensive customizations not included in initial budgets. Timeline slippage rarely happens all at once - it accumulates through a series of "small" delays that compound.
Successful implementations set aggressive but achievable milestones. Cloud-native platforms like FreightPOP, Shippo, and Cargoson typically deploy in 6-12 weeks, while enterprise solutions like Manhattan Active might require 6-12 months for full rollout.
The ROI Measurement Framework That Actually Works
Measuring TMS ROI requires precision, not promises. Gartner reports that TMS solutions with optimization features can deliver 2-15% ROI on transportation spend - and often in the first few months of deployment. But achieving these results requires disciplined measurement from day one.
The 60-Day ROI Framework
Start with concrete baselines. Document your current freight spend, processing time per shipment, carrier performance metrics, and manual task hours. Most teams underestimate the real cost of manual logistics tasks. If your operations staff costs €40/hour and your TMS eliminates 60 hours of manual work in the first month, that's €2,400 in immediate savings.
Track weekly KPIs: freight cost per kilometer, booking processing time, carrier performance rates, and user adoption percentages. Rather than waiting for monthly or quarterly reviews, track these metrics each week. Early warning signs become obvious when measured consistently.
Here's a realistic calculation for a mid-sized European manufacturer:
- Annual transport spend: €2M
- TMS investment: €200K (including implementation)
- Year one savings: €280K (14% improvement - conservative end of 15-25% typical range)
- Net ROI: 40% in year one
Hidden Value Multipliers Most Companies Miss
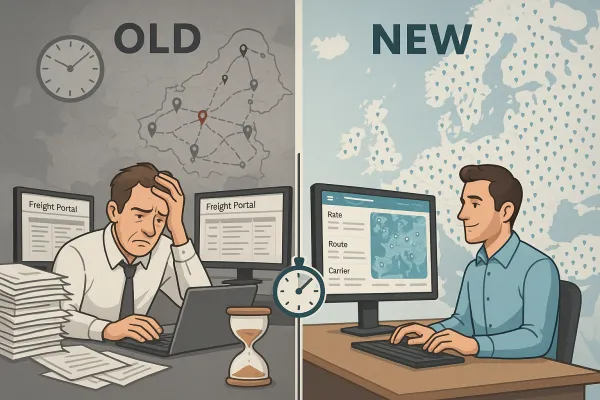
Organizations typically see 5-10% savings on freight budgets by automating rate comparisons. Automatic rate benchmarking surfaces the lowest qualified rates across your contract carriers and spot markets right at the moment of booking.
Gartner estimates automation can yield 1-3% freight cost savings and free countless hours of admin work. End-to-end digitization from order creation to EDI invoicing eliminates emails, spreadsheets, and redundant data entry.
Compliance benefits compound over time. The European Commission estimates eFTI could save the EU transport and logistics sector up to €1 billion per year. Systems that handle regulatory compliance automatically provide ongoing value that's difficult to quantify but expensive to lose.
The European Advantage: How to Turn Regional Complexity Into Competitive Strength
European companies often view their multi-country, multi-language, multi-regulation environment as a TMS implementation obstacle. Smart shippers flip this perspective entirely.
According to IRU's 2024 driver shortage survey, there are 426,000 unfilled truck driver positions across Europe. This capacity constraint creates competitive advantage for companies with efficient freight operations. Your TMS becomes a competitive weapon, not just a cost center.
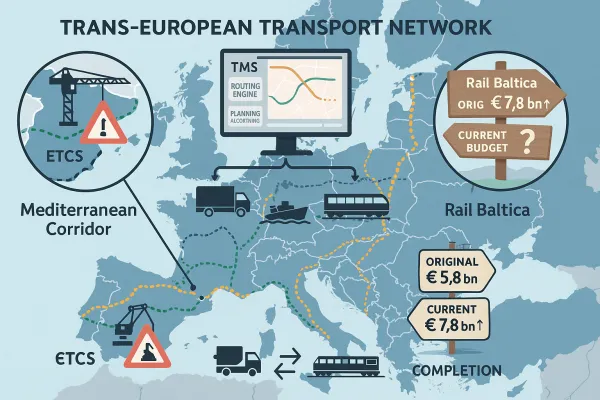
European regulatory requirements like eFTI, ETS, and Smart Tachograph 2.0 create barriers for competitors using manual processes or outdated systems. But only if your systems can actually support the digital transformation. Most legacy TMS solutions and rushed implementations won't be ready.
The vendor landscape reflects this European complexity. Major US-based providers like Oracle and SAP offer global solutions, while the European TMS market is served by specialized players like Transporeon (now owned by Trimble), 4flow, AEB in Germany; Generix and SINARI in France; Alpega in Austria; nShift in the Nordics; and others focused on regional requirements.
Mid-market solutions like Cargoson are gaining popularity among European manufacturers for their ability to handle European complexity without enterprise-level complexity or cost.
Your 90-Day Diagnostic Checklist: Preventing Failure Before It Starts
Pre-Implementation Assessment (Days 1-30)
- Document current freight spend by lane, carrier, and mode
- Map existing system integrations and data flows
- Survey users about current process pain points
- Identify carrier network requirements across all subsidiaries
- Assess regulatory compliance requirements by country
Vendor Evaluation Framework (Days 31-60)
- Test integration capabilities with your ERP/WMS
- Verify carrier network coverage for your lanes
- Calculate total cost of ownership over 3 years
- Request references from companies with similar complexity
- Pilot core functionality with real shipment data
Implementation Success Preparation (Days 61-90)
- Define success metrics and measurement processes
- Establish user training and change management plans
- Create fallback procedures for integration delays
- Set up weekly progress review meetings
- Negotiate implementation milestones with penalty clauses
The European TMS market's growth reflects genuine demand for transportation optimization. But growth statistics don't guarantee implementation success. Companies that diagnose potential failures before they occur join the successful 24%. Those who skip the diagnostic phase become another cautionary tale.
Your choice: spend €800,000 learning why diagnosis matters, or invest 90 days preventing that expensive lesson.